Assets Correlations
Correlation
Correlation is defined in statistics as the relationship between two or more variables. The relationship is established by observing the values of the variables. When used in finance, correlation is typically used to measure how the prices of two assets move in relation to each other. In the calculation of Portfolio Optimization, correlation is used to find stocks which have a low or negative correlation with each other for diversification purposes. Other than asset prices, some analysts use correlation to find the relationship between asset prices and the various fundamental indicators. An example is the relationship between the S&P 500 earnings with the U.S. Gross Domestic Product (GDP).Calculating the Correlation Coefficient
To calculate the correlation basically requires the values of two or more variables. If we have two set of values x and y, the following formula can be used.Correlation = Sum((x - Mean of x)*(y - Mean of y)) / SQRT(Sum((x - Mean of x)^2) * Sum((y - Mean of y)^2)
where x is each of the values of x and y is each of the values in y.
In Microsoft Excel, the Correl(x,y) function can be used to calculate the correlation quickly and easily.
Assets Correlations Spreadsheet
This spreadsheet downloads stock price data from https://finance.yahoo.com and calculates the correlation between the different stocks specified automatically. It is useful for finding correlations between different assets to use in the construction of an optimum portfolio. The free version supports up to 2 stocks while the professional version supports up to 7 stocks. When the correlations of more than two assets are required, a correlation matrix is used.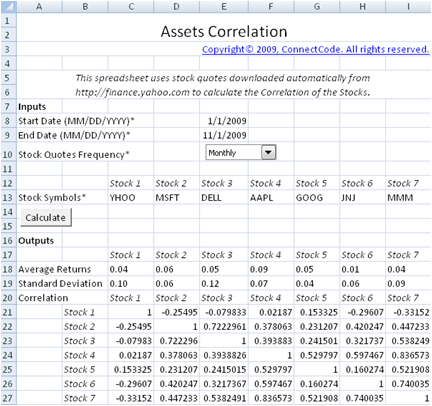
Inputs
- Start Date (MM/DD/YYYY) - Start date to download the stock price.
- End Date (MM/DD/YYYY) - End date to download the stock price.
- Stock Quotes Frequency - Download the Monthly, Weekly or Daily stock prices.
- Stock Symbols - The stock symbol of the stock to download the stock price.
Outputs
- Average Returns - The stock prices are downloaded for a specified frequency as mentioned in the inputs. Based on the specified frequency, the average returns will be calculated. For example, if the frequency chosen is "Monthly", then monthly stock prices will be downloaded. The returns each month will be calculated automatically in the background. After which, the average returns of each month will be calculated as follows:
Returns from January to February = (Price in February- Price in January) / Price in January
Returns from February to March = (Price in March - Price in February) / Price in February
Average Returns = (Returns from January to February + Returns from February to March) / 2
For other types of download frequency, the average returns will be calculated in a similar manner. - Standard Deviation - The standard deviation of the returns is calculated in this field.
- Correlation - The correlation of the returns are calculated in this field. If two stocks have a tendency to move in the same direction, it will be shown as a positive number. If two stocks do not have a tendency to move in the same direction, it will be shown as a negative number or a very small positive number.
Download Free Assets Correlations spreadsheet - v1.1
System RequirementsMicrosoft® Windows 7, Windows 8 or Windows 10
Windows Server 2003, 2008, 2012 or 2016
512 MB RAM
5 MB of Hard Disk space
Excel 2007, 2010, 2013 or 2016
License
By downloading this software from our web site, you agree to the terms of our license agreement.
Download
FreeAssetCorrelation.zip (Zip Format - 94 KB)
Get the Professional version
Benefits- Unlocked
- Allows removal of copyright message in the template
- Allows commercial use within the company
- Allows customization of the model
- Full source code
Price
USD10.00 - Purchase - Download the Professional version for Free! (Limited Time only!)