Modern Portfolio Risk (Mean, Variance, Standard Deviation and Correlation)
Background
In 1952, Harry Markowitz wrote a paper call "Portfolio Selection" which was published by the Journal of Finance. In this paper, he described how investors can maximize their expected returns while minimizing risks. Together with William Sharpe who formalized the concept of Capital Asset Pricing Model (CAPM) they brought about what was known as the Modern Portfolio Theory.The main rationale behind the theory is if investors were given a choice of investing in two different assets which provides the same returns but have different risks, the investors would likely choose the asset with a lesser risk.
Portfolio Risk
In finance, risk is defined as the uncertainty that an investor has to face. For a security like a stock it is measured as the volatility of the returns of the stock over a period of time. Similarly, for a portfolio, it is the volatility of the returns of the portfolio over a period of time.The Standard Deviation is one way for tracking this volatility of the returns. Another way is through the Beta of the Stock or the Portfolio. Beta is a relative measure that measures the volatility of the stock or portfolio with respect to that of the market.
A portfolio is simply a combination of assets or securities. The Modern Portfolio Theory describes how investors can combine different assets to create a portfolio that reduces risk but not the expected returns. This is considered the main aim of holding a portfolio over holding specific asset. The combination of different assets, especially uncorrelated assets, is known commonly as diversification. This is where you frequently hear people talk about how diversification reduces risks.
Portfolio Risk Calculator Spreadsheet
This spreadsheet starts by calculating the Returns of the individual stocks, the Returns of the Portfolio and the Returns of the Market based on historical prices. The Returns are then used in the calculation of the Mean, Variance and the Standard Deviation. The Portfolio Mean, Variance and Standard Deviation are also calculated to allow you to see the effects of diversification. The spreadsheet also calculates the Beta of the Portfolio which is another measure of risk and the Correlation of the Portfolio with the Market.
Inputs
Proportion The Portfolio Risk spreadsheet allows diversification of up to 6 different stocks by default. The first part of the spreadsheet allows you to key in the proportion of each stock in the portfolio. You can use the Total field in the spreadsheet as a guide to ensure that the total proportion sums up to 100%.Price The second part allows you to key in the prices of the stock and the market in the past 1 year. It is possible to download prices from websites like https://finance.yahoo.com. You can also refer to our spreadsheet on automatic downloading of stock data. The prices will be used for the calculation of returns and other results in the Outputs section.
Outputs
The outputs of the spreadsheet are listed below.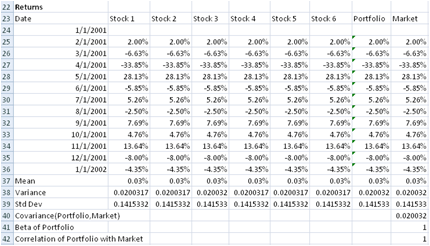
Download Free Modern Portfolio Risk spreadsheet - v1.0
System RequirementsMicrosoft® Windows 7, Windows 8 or Windows 10
Windows Server 2003, 2008, 2012 or 2016
512 MB RAM
5 MB of Hard Disk space
Excel 2007, 2010, 2013 or 2016
License
By downloading this software from our web site, you agree to the terms of our license agreement.
Download
FreeModernPortfolioRisk.zip (Zip Format - 94 KB)
Get the Professional version
Benefits- Unlocked
- Allows removal of copyright message in the template
- Allows commercial use within the company
- Allows customization of the model
- Full source code
- Sharpe Ratio, Jensen Alpha and Treynor Index
Price
Download Professional
ModernPortfolioRisk.zip