- TraderCode Technical Indicators
- Neural Networks Trading
- Financial Modeling - Free Investment and Financial Calculator
TraderCode - Technical Indicators and Technical Analysis Software
TraderCode is a comprehensive library of technical indicators and technical analysis functions for use with Microsoft Excel. It allows you to create many types of technical indicators used in trading systems like Moving Average, Bollinger Bands, Average Directional Movement Index, Oscillators, True Range, Standard Deviation, Donchian Channels and many more. With these indicators you can easily perform end-of-day analysis or back-testing of historical stock data. The software comes with both formulas for Excel and a built-in Wizard to help you create the indicators.

Price $69 (Single User License)
User feedbacks
Using Microsoft Excel as a platform
The reason for choosing Excel as the platform is an obvious one. It is the ubiquitous tool for analyzing data and crunching numbers. Different tasks like importing data, calculating formulas, charting results and analysing scenario can be easily carried out. It is also one of the most commonly used software by financial and technical analysts. By building on top of the Excel platform, users of TraderCode can tap on the vast variety of functions offered by Excel for further understanding of their data.Components of TraderCode
TraderCode software is divided into three major components, the Technical Analysis Add-In, the Formulas and the Experts.Technical Analysis Add-In and Formulas
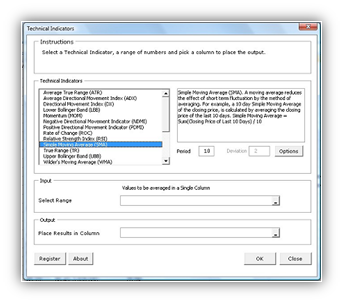
The Technical Analysis Add-In and Formulas form the foundation of TraderCode since the first version of this popular software. The Add-In allows a user without any prior experience to quickly and easily create technical indicators from a user interface wizard. It also performs validation of the data, allows specification of where the output is to be located and guiding the user in creating the indicators accurately.
For more information, see the Technical Analysis Add-In Tutorial.
The Formulas on the other hand allow users who are more inclined to using Excel formulas to create the indicators in a similar manner.
Technical Analysis Expert
The Technical Analysis Expert is a spreadsheet model that helps you create your own trading system based on the different technical indicators. You can create multiple technical indicators, vary the parameters and repeat the tasks in a spreadsheet environment quickly and easily.
Analysis Expert is unique and extremely productive for technical analysis. It is built on top of the Analysis Add-In and Formulas foundation and is a result of listening to feedbacks and suggestions from our users. Many analysts and users are familiar with spreadsheets and prefer using a spreadsheet environment to a user interface (UI) tool for technical analysis.
For more information, see the Technical Analysis Expert Tutorial or the Technical Analysis Expert Demo Video.
Backtesting Expert
The Backtesting Expert is a spreadsheet model that helps you create trading strategies using the technical indicators and run the strategies through historical data. The performance of the strategies can then be measured and analyzed quickly and easily.
The model can be setup to enter Long or Short positions when certain conditions occur and exit the positions when another set of conditions are met. By trading automatically on historical data, the model can determine the profitability of a trading strategy.
For example, a trader can setup strategies for the Backtesting Expert to enter a Long position when the 12 days moving average of the price crosses above the 24 days moving average. On top of that, the Backtesting Expert can be configured to exit from the Long position when the profit or loss exceeds 10 percent of the original purchase price.
The flexible Backtesting Expert works well with the Analysis Expert. It is able to make use of the different technical indicators generated by the Analysis Expert to make decisions on when to enter or exit a position.

For more information, see the Strategy Backtesting Tutorial or the Strategy Backtesting Demo Video.
Point-and-Figure Charting Expert
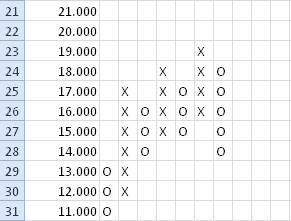
Point-and-Figure charting is an analysis technique that has been around for many years. It has recently become very popular among traders and investors. This technical analysis technique uses a chart with "X"s and "O"s for predicting financial asset prices. The "X"s are used to indicate rising prices and "O"s to indicate falling prices. The point-and-figure chart is very unique as it does not plot prices against time like other technical analysis charts. Volume is also not taken into account, so it is basically a chart based purely on price movements.
This charting Expert helps you plot Point-and-Figure charts automatically. You can also setup important parameters such as the Box Size and Reversal easily. Besides being able to chart the past prices automatically, you can also choose to plot the chart manually in the Expert to get a better feel of the price trends.
For more information, see the Point-and-Figure Charting Expert Tutorial.
TraderCode Technical Analysis Software
- TraderCode is a very useful toolbox for stock traders. You can use it to compute the indicator values for stock prices and plot them in Excel.
- TraderCode provides a convenient library so you can make the computations of the indicators yourself and plot and analyze them.
- A built-in wizard accompanies the library, so that you can use the user interface to select ranges quickly and obtain results.
- TraderCode currently supports some of the most popular and successful technical indicators used by many analysts.
- As you play around with the indicators and become more experienced, you will appreciate the fact that using the different indicators to predict stock prices is like viewing the market in different angles (while suppressing other angles), and they may give very different results.
-
The indicators attempt to express as a formula the different relationships that many traders have abstracted over the years of their trading experiences. For example,
- the relationship between prices and volume (OBV)
- the short-term price fluctations along a trend (MACD)
- stock cycles (Moving Averages applied to long term stock movements)
- You may also creatively 'invent' your own indicator using the basic set of functions provided by the TraderCode library. For example, you can try to measure the level of a stock price with respect to several of its competitors by plotting their moving averages alongside each other.
- Depending on the angle you used to compute the indicators, for e.g, the window or period of analysis, you will be able to detect the buy or sell signals, overbought or oversold levels, bullish or bearish signs. The different parameters (e.g the period) that is used to compute the same indicator will predict different results under different situations.
- For example, using the MACD indicator, a same point in time in the chart may sometimes indicate a bullish level when using one set of periods, while the same point may indicates a bearish level when using another set of periods. So it is important to choose the periods carefully. And even if many pairs of periods indicate an bullish level, it may still be possible that other factors not taken into account by this indicator will affect the stock price.
- Also it must be stressed that the fact that multiple traders using the same indicator (with the same parameters) to predict the bullish/bearish signals and taking action as a result of the prediction will alter the outcome itself.
- Thus, understanding these indicators and applying them appropriately will give you a more accurate picture of the market, and TraderCode is the ideal tool for doing so.
-
The technical indicators currently implemented by TraderCode include
- SafeZone Stop
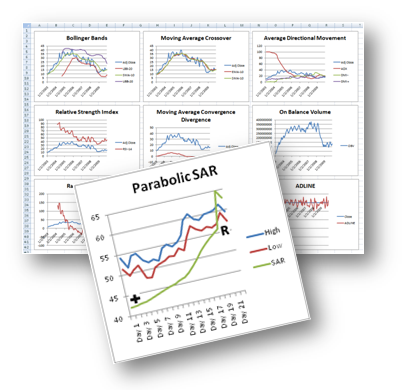
- Parabolic (SAR)
- MACD Signal Line (MACDSL)
- MACD Histogram (MACDHI)
- Guppy Multiple Moving Average™
- Accumulation / Distribution Line (ADLINE)
- Average Directional Movement Index (ADX)
- Average True Range (ATR)
- Chaikin Money Flow (CMF)
- Commodity Channel Index (CCI)
- Directional Movement Index (DX)
- Donchian Lower Band
- Donchian Middle Band
- Donchian Upper Band
- Elder Force Index (EFI)
- Elder-Ray Index Bear Power
- Elder-Ray Index Bull Power
- Exponential Moving Average (EMA)
- Fibonacci Extension (FIBE)
- Fibonacci Retracement (FIBR)
- Fibonacci Fan (FIBF)
- Linear Regression Indicator (LRI)
- Lower Bollinger Band (LBB)
- Momentum (MOM)
- Money Flow Index (MFI)
- Moving Average Convergence/Divergence (MACD)
- Negative Directional Movement Indicator (NDMI)
- On Balance Volume (OBV)
- Percentage Price Oscillator (PPO)
- Percentage Volume Oscillator (PVO)
- Positive Directional Movement Indicator (PDMI)
- Rate of Change (ROC)
- Relative Strength Index (RSI)
- Simple Moving Average (SMA)
- Sine Weighted Moving Average (SWMA)
- Stochastic Oscillator (%D)
- Stochastic Oscillator (%K)
- Triangular Moving Average (TMA)
- True Range (TR)
- Upper Bollinger Band (UBB)
- Ulcer Index (UIX)
- Wilder's Moving Average (WMA)
- Williams %R
-
External Integration
- TraderCode provides the flexibility for you to use external market data for analysis, charting and backtesting. You may have obtained your market data by exporting data to a comma-separated values (csv) file in some existing trading tools or you may have purchased an entire collection of historical data from some well-known data vendors. In any of these cases, TraderCode lets you use these data very quickly and easily.
- FOREX Technical Analysis - Import FOREX Market Data for Technical Analysis.
Download TraderCode 5.7
Download a free trial of the TraderCode Technical Analysis Software Add-In for Microsoft Excel .
System Requirements
- Windows 7, Windows 8 or Windows 10
- 512 MB RAM
- 25 MB of Hard Disk space
- Excel 2003, Excel 2007, Excel 2010, Excel 2013 or Excel 2016
TechnicalIndicators.exe (EXE Format - 5794 KB)
TechnicalIndicators.zip (Zip Format - 4700 KB)
Notes:
1. TraderCode requires the Excel macro settings to be enabled to run successfully. After installation of the software, you can follow the steps below to enable the settings.
- Goto Start Menu->All Programs->Microsoft Office->Microsoft Excel.
- Goto the Developer tab and click on the Macro Security button.
- Set the Macro settings to Enable all macros and click on the OK button.