Technical Analysis Expert
Technical Analysis Expert Step by Step Tutorial
1. Start the Technical Analysis ExpertThe Technical Analysis Expert can be started from the Windows Start Menu-> Programs -> TraderCode -> Technical Analysis Expert.
This launches a spreadsheet model with multiple worksheets for you to generate technical analysis indicators, chart the results and configure the technical indicators parameters.
2. Click on the "DownloadedData" worksheet.

3. The "DownloadedData" worksheet is shown in the diagram below.
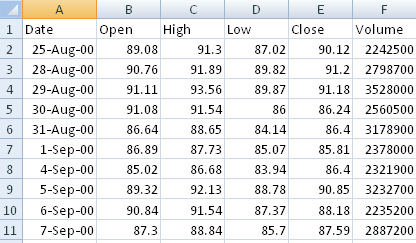
You can copy data from any spreadsheets or comma-separated values (csv) files to this worksheet for technical analysis. The format of the data is as shown in the diagram. Alternatively, you can refer to the "Download Stock Trading Data" document to download data from well-known data sources such as Yahoo Finance, Google Finance or Forex.com for use in the Technical Analysis Expert.
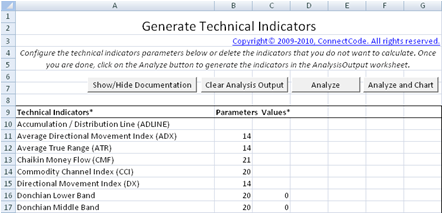
4. Once you have copied the data, go to the "AnalysisInput" worksheet and click on the "Analyze and Chart" button. This will generate the different technical indicators in the "AnalysisOutput" worksheet.
Note that over 40 types of technical indicators can be created very quickly and easily.
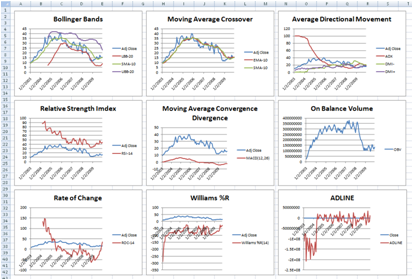
5. The charts output is generated in the "ChartOutput" worksheet. The charts can be configured and setup in the "ChartInput" worksheet.
Explanation of the different Worksheets
AnalysisInput worksheet
This is the worksheet to configure the parameters of the different technical indicators. You can delete the technical indicators that you do not use or create multiple copies of the same technical indicator with different parameters.
- Technical Indicators* - The names of the technical indicators. The following list of indicators is supported. Please note that the name of the indicators must match exactly as the names specified below. It will be easier if you copy and paste the names from an existing spreadsheet. Simply leave blank if no technical indicator is required. It is important to note that the technical indicators are generated in the sequence specified.
- Accumulation / Distribution Line (ADLINE)
- Average Directional Movement Index (ADX)
- Average True Range (ATR)
- Chaikin Money Flow (CMF)
- Commodity Channel Index (CCI)
- Directional Movement Index (DX)
- Donchian Lower Band
- Donchian Middle Band
- Donchian Upper Band
- Elder Force Index (EFI)
- Elder-Ray Index Bear Power (ERBE)
- Elder-Ray Index Bull Power (ERBU)
- Exponential Moving Average (EMA)
- Fibonacci Extension (FIBE)
- Fibonacci Fan (FIBF)
- Fibonacci Retracement (FIBR)
- Linear Regression Indicator (LRI)
- Lower Bollinger Band (LBB)
- Momentum (MOM)
- Money Flow Index (MFI)
- Moving Average Convergence/Divergence (MACD)
- Negative Directional Movement Indicator (NDMI)
- On Balance Volume (OBV)
- Parabolic (SAR)
- Percentage Price Oscillator (PPO)
- Percentage Volume Oscillator (PVO)
- Pivot Point - Camarilla (PIVOTCAM)
- Pivot Point - DeMark's System (PIVOTDMK)
- Pivot Point - Woodie's System (PIVOTWD)
- Pivot Point (PIVOT)
- Positive Directional Movement Indicator (PDMI)
- Rate of Change (ROC)
- Relative Strength Index (RSI)
- Simple Moving Average (SMA)
- Sine Weighted Moving Average (SWMA)
- Stochastic Oscillator (%D)
- Stochastic Oscillator (%K)
- Triangular Moving Average (TMA)
- True Range (TR)
- Ulcer Index (UIX)
- Upper Bollinger Band (UBB)
- Wilder's Moving Average (WMA)
- Williams %R
- Parameters Values* - Different technical indicators require different parameters. The values of the different parameters are specified in these six columns. Some indicators do not require parameters and you can simply leave the columns blank in the Parameter Values section. Each of the Parameter Values is described in the Parameter Names and Comments fields.
- Parameter Names and Comments - These two fields are for documentation purposes only. They describe the Parameter Values fields.
- Analyze button - This button allows you to generate the technical indicators in the "AnalysisOutput" worksheet.
- Analyze and Chart button - This button allows you to generate the technical indicators in the "AnalysisOutput" worksheet and technical analysis charts in the "ChartOuput" worksheet.
AnalysisOutput worksheet
This is the worksheet where the technical indicators are generated.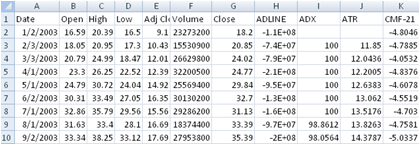
The downloaded data are first copied to this worksheet and the technical indicators will be generated according to the order in the "AnalysisInput" worksheet.
For example,
ADLINE, ADX, ATR, CMF-21 ...
ChartInput worksheet
This worksheet lets you generate and customize the different charts. The current spreadsheet allows up to a maximum of nine charts. The rationale behind this restriction is that most professional analysts have mentioned that they only rely on a handful of charts (typically less than 10 charts) as too many charts will negatively impact their decisions. The charts will be generated in the "ChartOutput" worksheet.
- Chart Name* - This name will be used as the Chart Title in the "ChartOutput" worksheet. It is used to identify a chart. If the name is left blank, no chart will be generated.
- Chart Columns (from AnalysisOutput)* - The columns from the "AnalysisOutput" worksheet to be used as the input source of the chart. Up to a maximum of six input columns are supported. The columns are specified using the column alphabet. For example, column "A" is the "Date" field, column "B" is the "Open" field and column "C" is the "High" field. Only columns "A" - "CZ" are supported.
- Clear Charts button - Delete all the charts in the "ChartOutput" worksheet.
- Chart It button - Generate the charts in the "ChartOutput" worksheet.
ChartOutput worksheet
The charts specified in the "ChartInput" worksheet are generated in this worksheet.
They are placed in the following order to provide an easy overview.
| Chart 1 | Chart 2 | Chart 3 | |
| Chart 4 | Chart 5 | Chart 6 | |
| Chart 7 | Chart 8 | Chart 9 |
ExpertUIInternal worksheet
This is a worksheet that is used internally by the Technical Analysis Expert. Please do not delete or edit this worksheet.Back to TraderCode Technical Indicators