
The Bullet Graph uses a linear and no-frills design to display data in a small space. It is useful for comparing performance at different points in time. The following diagram illustrates the different components of a Bullet Graph.
This following is the option dialog for Bullet Graphs.
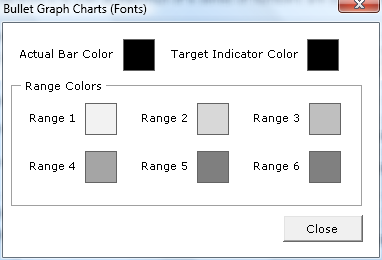
Actual Bar Color - the color of the Actual Performance Bar.
Target Indicator Color - the color of the Target Indicator.
Range Colors
Bullet Graphs also support the display of different series of numbers in different colors. The concept is similar to that of a Bar Graph.
- Range 1 Color for Number Series 1
- Range 2 Color for Number Series 2
- Range 3 Color for Number Series 3
- Range 4 Color for Number Series 4
- Range 5 Color for Number Series 5
- Range 6 Color for Number Series 6