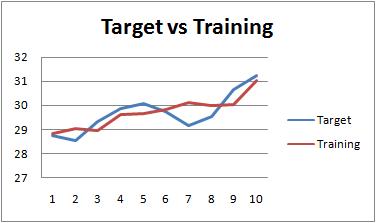
Training NeuralCode with Stock information with Charts displaying the progress
You can also see the underlying training being carried out by configuring NeuralCode to display a Chart to show the progress.- Launch the Show Training in a Chart Worksheet
- Click on "NeuralCode" to launch the training and prediction dialog. Click on the "Input Range" text box. Select cells A2 to D11. Make sure you see 'Predict Stock Prices'!$A$2:$D$11 in the text box.
-
Click on the "Target Column" text box. Select column "F" in the text box. We are training the networks with Tomorrow's Closing price to give it the ability to predict future prices with historical information.
Click on the Options button. We are going set up to display the training progress in a Chart. In "Show Training Progress in a Chart", select "Yes". Choose column "H" as the working column. NeuralCode will dump out the training output to this column periodically.
- Set the "Target Error Rate" to 0.0007. A much smaller value so that the training takes longer.
- Click on the "New Training" button. An Excel Chart will appear to show you the progress of the training.
Tip:
Showing the progress in a Chart gives you the confidence that NeuralCode can learn the big picture from your training data. Once you are confident with NeuralCode, remember that it is faster to train without the Charts.
You can delete the chart anytime, NeuralCode only uses it to display the training progress.