Treynor Performance Index
Treynor Performance Index, invented by Jack Treynor is also known as Treynor Composite Performance Measure or Treynor ratio. It is a measure of reward (or excess return) per unit of risk. Treynor Performance Index = (Average Returns of Portfolio - Average Risk Free Rate) / Beta The formula uses the portfolio's Beta as the unit of risk. Reward (or excess returns) is measured as the difference between the portfolio's return and the risk-free rate of return over a period. The higher the Treynor Performance Index, the better the portfolio's performance.Treynor Performance Index Spreadsheet
TreynorPerformanceIndex Worksheet
The TreynorPerformanceIndex worksheet calculates the average annual returns of a portfolio over a 5 year period. It then uses the specified Average Annual Risk free rate and Beta to calculate the Treynor Performance Index.
TreynorMultiplePorfolios Worksheet
The TreynorMultiplePorfolios worksheet calculates the Treynor Performance Index for up to 5 portfolios.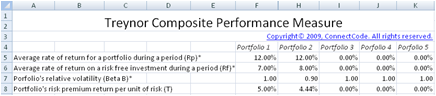
Inputs
- Rp - Average rate of return for a portfolio during a period
- Rf - Average rate of return on a risk free investment during a period
- Beta B - Porfolio's relative volatility
- T - Portfolio's risk premium return per unit of risk
Download Free Treynor Performance Index spreadsheet - v1.0
System RequirementsMicrosoft® Windows 7, Windows 8 or Windows 10
Windows Server 2003, 2008, 2012 or 2016
512 MB RAM
5 MB of Hard Disk space
Excel 2007, 2010, 2013 or 2016
License
By downloading this software from our web site, you agree to the terms of our license agreement.
Download
FreeTreynorPerformanceIndex.zip (Zip Format - 91 KB)
Get the Professional version
Benefits- Unlocked
- Allows removal of copyright message in the template
- Allows commercial use within the company
- Allows customization of the model
- Full source code
- Portfolio Risk, Jensen Alpha and Sharpe Ratio
Price
Download Professional
TreynorPerformanceIndex.zip