Strategy Backtesting in Excel
Strategy Backtesting Expert
Overview
The Backtesting Expert is a spreadsheet model that allows you to create trading strategies using the technical indicators and running the strategies through historical data. The performance of the strategies can then be measured and analyzed quickly and easily.During the backtesting process, the Backtesting Expert runs through the historical data in a row by row manner from top to bottom. Each strategy specified will be evaluated to determine whether the entry conditions are met. If the conditions are satisfied, a trade will be entered.
On the other hand, if the exit conditions are met, a position that was entered previously will be exited. Different variations of technical indicators can be generated and combined to form a trading strategy. This makes the Backtesting Expert an extremely powerful and flexible tool.
Backtesting Expert
The Backtesting Expert is a spreadsheet model that allows you to create trading strategies using the technical indicators and running the strategies through historical data. The performance of the strategies can then be measured and analyzed quickly and easily.The model can be setup to enter into Long or Short positions when certain conditions occur and exit the positions when another set of conditions are met. By trading automatically on historical data, the model can determine the profitability of a trading strategy.
Backtesting Expert Step by Step Tutorial
1. Start the Backtesting Expert The Backtesting Expert can be started from the Windows Start Menu-> Programs -> TraderCode -> Backtesting Expert. This launches a spreadsheet model with multiple worksheets for you to generate technical analysis indicators and run back tests on the different strategies.You will notice the Backtesting Expert includes many familiar worksheets like "DownloadedData", "AnalysisInput", "AnalysisOutput", "ChartInput" and "ChartOutput" from the Technical Analysis Expert model. This allows you to run all your back tests quickly and easily from a familiar spreadsheet environment.
2. First, select the "DownloadedData" worksheet.
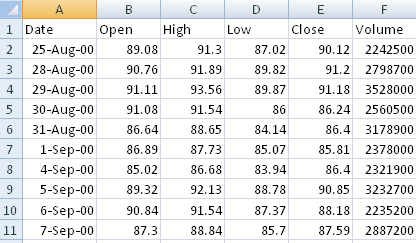
You can copy data from any spreadsheets or comma-separated values (csv) files to this worksheet for technical analysis. The format of the data is as shown in the diagram. Alternatively, you can refer to the "Download Stock Trading Data" document to download data from well-known data sources such as Yahoo Finance, Google Finance or Forex.com for use in the Backtesting Expert.
3. Once you have copied the data, go to the "AnalysisInput" worksheet and click on the "Analyze and BackTest" button. This will generate the different technical indicators into the "AnalysisOutput" worksheet and perform backtesting on the strategies specified in the "StrategyBackTestingInput" worksheet.
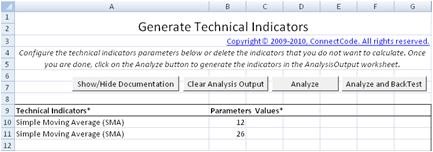
4. Click on the "StrategyBackTestingInput" worksheet. In this tutorial you will only need to know that we have specified both a long and short strategies using moving average crossovers. We will be going into details of specifying strategies in the next section of this document.
The diagram below shows the two strategies.

5. Once the back tests are completed, the output will be placed in the "AnalysisOutput", "TradeLogOutput" and "TradeSummaryOutput" worksheets.
The "AnalysisOutput" worksheet contains the full historical prices and the technical indicators of the stock. During the back tests, if the conditions for a strategy are satisfied, information such as the buying price, selling price, commission and profit/loss will be recorded in this worksheet for easy reference. This information is useful if you like to trace through the strategies to see how the stock positions are entered and exited.
The "TradeLogOutput" worksheet contains a summary of the trades carried out by the Backtesting Expert. The data can be easily filtered to only show data for a specific strategy. This worksheet is useful for determining the overall profit or loss of a strategy at different time frames.

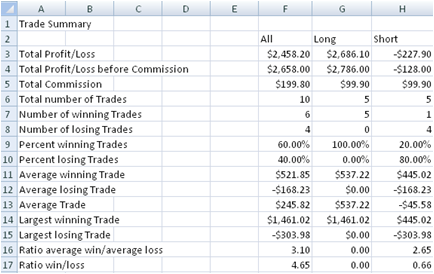
The most important output of the back tests is placed in the "TradeSummaryOutput" worksheet. This worksheet contains the total profit of the strategies carried out.
As shown in the diagram below, the strategies generated a total profit of $2,548.20 by making a total of 10 trades. Of these trades, 5 are Long positions and 5 are Short positions. The Ratio win/loss of greater than 1 indicates a profitable strategy.
Explanation of the different Worksheets
This section contains the detailed explanation of the different worksheets in the Backtesting Expert model. The "DownloadedData", "AnalysisInput", "AnalysOutput", "ChartInput" and "ChartOutput" worksheets are the same as in the Technical Analysis Expert model. Thus they will not be described in this section. For a complete description of these worksheets, please refer to the Technical Analysis Expert section.StrategyBackTestingInput worksheet
All the inputs for backtesting including the strategies are entered using this worksheet. A strategy is basically a set of conditions or rules which you will buy in a stock or sell a stock. For example, you may want to execute a strategy to go Long (purchase stocks) if the 12 days moving average of the price crosses above the 24 days moving average. This worksheet works together with the technical indicators and price data in the "AnalysisOutput" worksheet. Hence the moving average technical indicators have to be generated in order to have a trading strategy based on moving average.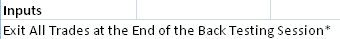
The first input required in this worksheet (as shown in the diagram below) is to specify whether to “Exit All Trades at the End of the Back Testing Session”. Imagine the scenario where conditions for purchasing a stock has occurred and the Backtesting Expert entered a Long (or Short) trade. However the time frame is too short and has ended before the trade can meet the exit conditions, resulting in some trades not exited when the backtesting session ends. You can set this to “Y” to force all trades to be exited at the end of the backtesting session. Else, the trades will be left opened when backtesting session ends.
Strategies
A maximum of 10 strategies can be supported in one single back test. The diagram below shows the inputs required for specifying a strategy.
- Strategy Initials* - This input accepts a maximum of two alphabets or numbers. The Strategy Initials is used in the "AnalysisOutput" and "TradeLog" worksheets for identifying the strategies.
- Long(L)/Short(S)* - This is used to indicate whether to enter a Long or Short position when the entry conditions of the strategy are met.
-
Entry Conditions*
A Long or Short trade will be entered when the Entry Conditions are met. The Entry Conditions can be expressed as a formula expression. The formula expression is case sensitive and it can make use of Functions, Operators and Columns as described below.
Functions
- crossabove(X,Y) - Returns True if column X cross above column Y. This function checks the previous periods to ensure that a crossover has actually occurred.
- crossbelow(X,Y) - Returns True if column X cross below column Y. This function checks the previous periods to ensure that a crossover has actually occurred.
- and(logicalexpr,…) - Boolean And. Returns True if all the logical expressions are True.
- or(logicalexpr,…) - Boolean Or. Returns True if any of the logical expressions are True.
- daysago(X,10) - Returns the value (in column X) of 10 days ago.
- previoushigh(X,10) - Returns the highest value (in column X) of the last 10 days including today.
- previouslow(X,10) - Returns the lowest value (in the column X) of the last 10 days including today.
Operators
- < Less than
- > Greater than
- = Equal
- <> Not equal
- <= Less than or equal
- >= Greater than or equal
- + Addition
- - Subtraction
- * Multiplication
- / Division
Columns (from AnalysisOutput)
- A - Column A
- B - Column B
- C
- ..
- ..
- YY - Column YY
- ZZ - Column ZZ
This is the most interesting and flexible part of the Entry Conditions. It allows columns from the "AnalysisOutput" worksheet to be specified. When the back tests are carried out, each row from the column will be used for evaluation.
For example, "A > 50" means each of the rows in column A of the "AnalysisOutput" worksheet will be determined whether it is greater than 50.
Examples
-
A >= B
In this example, if the value in column A in "AnalysisOutput" worksheet is greater than or equal the value of column B, the entry condition will be satisfied. -
and(A > B,C>D)
In this example, if the value in column A in "AnalysisOutput" worksheet is greater than the value of column B and the value of column C is greater than column D, the entry condition will be satisfied. -
crossabove(A,B)
In this example, if the value of column A in "AnalysisOutput" worksheet crosses above the value of B, the entry condition will be satisfied. crossabove means that A originally has a value that is less than or equal to B and the value of A subsequently becomes greater than B.
-
Exit Conditions*
The Exit Conditions can make use of Functions, Operators and Columns as defined in the entry conditions. On top of that it can also make use of Variables as shown below.
Variables for Exit Conditions
- profit This is defined as the selling price minus the purchase price. The selling price must be greater than the purchase price for a profit to be made. Otherwise the profit will be zero.
- loss This is defined as the selling price minus the purchase price when the selling price is less than the purchase price.
- profitpct (selling price - purchase price) / purchase price Note : selling price must be greater than or equal to purchase price. Otherwise profitpct will be zero.
- losspct (selling price - purchase price) / purchase price Note : selling price must be less than purchase price. Otherwise losspct will be zero.
Examples
profitpct > 0.2
In this example, if the profit in terms of percentage is greater than 20%, the exit conditions will be satisfied.
- % Commission* - Commission in terms of a percentage of the trading price. If the trading price is $10 and "% Commission" is 0.1 then commission will be $1. The percentage commission and commission in dollars will be summed up to calculate the total commission.
- $ Commission* - Commission in dollar terms. The percentage commission and commission in dollars will be summed up to calculate the total commission.
- No. of Shares* - Number of shares to purchase or sell when the entry/exit conditions of the strategy are met.
TradeSummaryOutput worksheet
This is a worksheet that contains a summary of all the trades carried out during the back tests. The results are categorised into Long and Short Trades. A description of all the fields can be found below.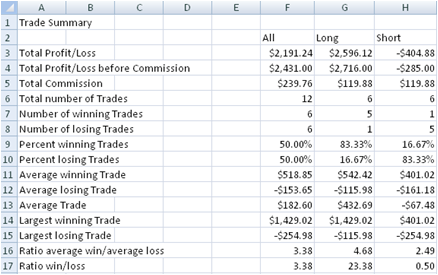
- Total Profit/Loss - Total profit or loss after commission. This value is calculated by summing all the profits and losses of all the trades simulated in the back test.
- Total Profit/Loss before Commission - Total profit or loss before commission. If commission is set to zero, this field will have the same value as Total Profit/Loss.
- Total Commission - Total commission required for all the trades simulated during the back test.
- Total number of Trades - Total number of trades carried out during the simulated back test.
- Number of winning Trades - Number of trades that make a profit.
- Number of losing Trades - Number of trades that make a loss.
- Percent winning Trades - Number of winning trades divided by Total number of trades.
- Percent losing Trades - Number of losing trades divided by Total number of trades.
- Average winning Trade - The average value of the profits of the winning trades.
- Average losing Trade - The average value of the losses of the losing trades.
- Average Trade - The average value (profit or loss) of a single trade of the simulated back test.
- Largest winning Trade - The profit of the largest winning trade.
- Largest losing Trade - The loss of the largest losing trade.
- Ratio average win/average loss - Average winning Trade divided by the Average losing Trade.
- Ratio win/loss - Sum of all the profits in the winning trades divided by the sum of all the losses in the losing trades. A ratio of greater than 1 indicates a profitable strategy.
TradeLogOutput worksheet
This worksheet contains all the trades simulated by the Backtesting Expert sorted by the date. It allows you to zoom in to any specific trade or time frame to determine the profitability of a strategy quickly and easily.
- Date - The date where a Long or Short position is entered or exited.
- Strategy - The strategy that is used for executing this trade.
- Position - The position of the trade, whether Long or Short.
- Trade - Indicates whether this trade is buying or selling stocks.
- Shares - Number of shares traded.
- Price - The price in which the stocks are purchased or sold.
- Comm. - Total commission for this trade.
- P&L (B4 Comm.) - Profit or Loss before commission.
- P&L (Aft Comm.) - Profit or Loss after commission.
- Cum. P&L (Aft Comm.) - Cumulative profit or loss after commissions. This is calculated as the cumulative total profit/loss from the first day of a trade.
- P&L (on Closing Position) - Profit or loss when the position is closed (exited). Both the entry commission and exit commission will be accounted for in this P&L. For example, if we have a Long position where the P&L (B4 Comm.) is $100. Assuming when the position is entered, a $10 commission is charged and when the position is exited, another commission of $10 is charged. The P&L (on Closing Position) is $100- $10 - $10 = $80. Both the commission on entering the position and exiting the position are accounted for on position close.